New thematic maps: Africa’s Economic Growth from a Labour Perspective; Access to Sanitation; Access to Drinking Water
The ASC has published three new thematic maps: Africa’s Economic Growth from a Labour Perspective; Sanitation in Africa; and Drinking Water in
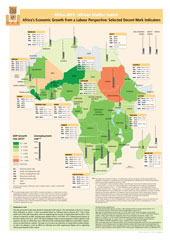
 Africa’s Economic Growth from a Labour Perspective: Selected Decent Work Indicators
According to IMF figures, six out of ten of the world’s fastest-growing economies in 2011 were in Africa. This map considers the economic growth of African countries from a labour perspective, using selected Decent Work Indicators as defined by the ILO (International Labour Organization). The indicators used on the map are e.g. the informal work sector rate, the youth unemployment rate, the child in employment rate and the working poverty rate. It becomes clear from the map that for example in Niger, the GDP growth rate for 2012 (Worldbank figures) was among the highest in Africa. At the same time, the child in employment rate for this country was 50,1%, and the working poverty rate (people who do work, yet live below Poverty Line) was 51,4%.
The makers of the map stress the inconsistency in data collecting in African countries, with regards to the time at which they were collected and methodological differences, which makes it hard to compare across and between countries.
The information for this map was compiled by Zjos Vlaminck, Ursula Oberst, Dr André Leliveld, Dr Mayke Kaag (all ASC), Dr William Baah-Boateng (University of Ghana), Sherif maher (Suez Canal University) and Nel de Vink (DeVink Mapdesign).
 Sanitation in Africa: Access to Improved Sanitation Facility and Improvement Index
This map shows two things: the percentage of the population that had access to an improved sanitation facility in 2011. And the Improvement Index: the percentage of growth of the population with access to an improved sanitation facility, divided by the percentage of population growth between 1990 and 2011. In countries with an index of less than 1, population growth is higher than the growth of access to an improved sanitation facility.
It becomes clear from the map that e.g. Ethiopia scores really high on the Improvement Index, yet at the same time the percentage of population with access to improved sanitation facility in 2011 was still only 20%. The map also shows that rural populations have much more access to sanitation than urban populations, since the population in the cities is growing really fast.
The information for this map was compiled by Dr Dick Foeken, dr Marcel Rutten and Nel de Vink (DeVink Mapdesign).
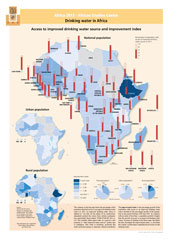
 Drinking water in Africa: Access to Improved Drinking Water Source and Improvement Index
This map shows two things: the percentage of the population that had access to an improved drinking water source in 2011. And the Improvement Index: the percentage of growth of the population with access to an improved drinking water source, divided by the percentage of population growth between 1990 and 2011. In countries with an index of less than 1, population growth is higher than the growth of access to an improved drinking water source. To take Ethiopia as an example again: it scores really high on the Improvement Index, yet at the same time the percentage of population with access to improved drinking water source in 2011 was still only 50%. Also this map shows that rural populations have more access to an improved drinking water source than urban populations, since in the cities the population is growing so fast.
The information for this map was compiled by Dr Dick Foeken, Dr Marcel Rutten and Nel de Vink (DeVink Mapdesign).
The maps can be ordered by sending an email to asc@ascleiden.nl, free of charge (only shipping costs).

